Today I am going to show how to write a mixed graph/ combined graph. This is about Task 1 for academic IELTS students who are going to take the test.
Sample answer from admin:
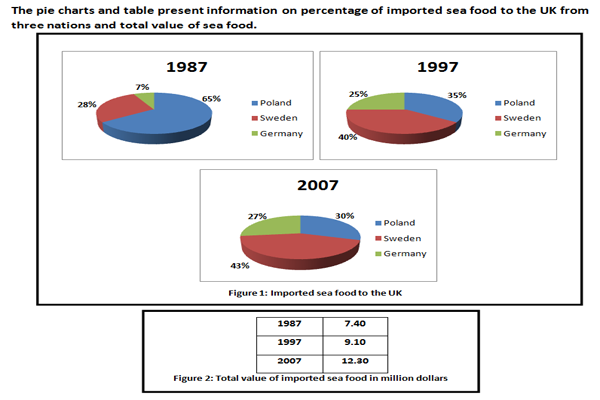
The pie charts display the amount of sea food which the UK brought in from Poland, Sweden and Germany in 1987, 1997 and 2007 whereas the table provides total value of sea food which was imported to the UK from those countries in the same time.
Overall, the most dominant country to export sea food in the UK market is Poland at the start, but this place is taken by Sweden at the end. Meanwhile, the total value of import nearly doubles over this twenty-year period.
As far as the pie charts are concerned, Poland was the biggest supplier of sea food in UK market in 1987, which was 65% of the total import. Comparatively, Sweden and Germany provided 28% and 7% of the sea food in UK. Sweden started to dominate over Poland with 40% after 10 years and held the same position in 2007 with 3% more than 1997. Germany followed the trend of Sweden, earning a quarter of the share of import in 1997 which increased to 27% at the culmination. By 2007, Poland became the lowest supplier with 30%.
The table illustrates that the sum value of imported sea food in 1987 was $7.40 million, which developed to $9.10 million in 1997 and ended in $12.30 million in the last year.
(Word count : 198)

