IELTS Writing Task 1: Cambridge 14 Test 1, three pie charts; analysis of candidate’s answer, strategies & a band 8+ sample answer
In this IELTS Writing Task 1 post, we are going to have a look at an Academic Writing Task 1 question from Cambridge IELTS Series 14, the latest publication of Cambridge IELTS Series. IELTS candidates will find an analysis of the 6.5 grade model answer for these three pie charts combined in the last part of the book for this question and then an attempt to make the answer a better one which can be graded a far greater band-score. This post is intended to guide IELTS learners and candidates to gather a better idea about Writing Task 1.
Cambridge IELTS 14 Test 1 Writing Task 1: Three pie charts on nutrients in American meals
Here is the original question from the book:
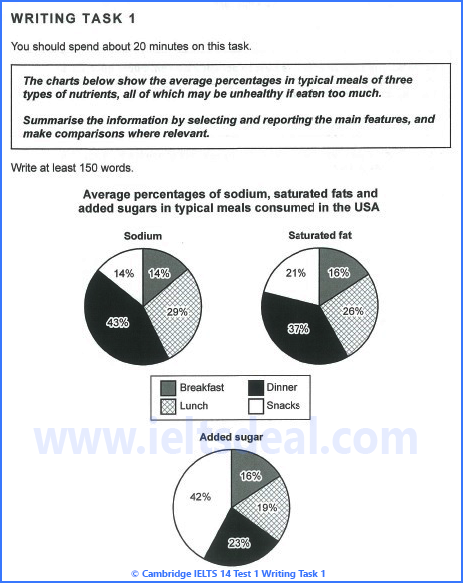
As you can see, this is a pie chart question where some datum are given on the percentage of nutrition values in three nutrients found in four typical or classic USA meals, namely breakfast, lunch, dinner and snacks. The meals are separated in each pie chart using different colour patterns. We have three pie charts here; the first one representing Sodium, the second one for Saturated fat and the third one symbolizing Added sugar.
In this post, first we’re going to analyse the sample answer written by a candidate provided in the last part of the book which was awarded a 6.5 band-score.
Here’s the sample answer:
The diagrams illustrate the average proportions of three types of nutrients in typical meals, which can be unhealthy if consumed too much. The three types include sodium, saturated fats and added sugar. The data is taken from the United States of America.
The first chart shows the average percentages of sodium. Dinner contains the most sodium (43%). Breakfast and snacks include an equal proportion of sodium consumed, with each of them adding up 14% of sodium. Through eating lunch, 29% sodium is consumed. The second chart shows the percentage of saturated fat in meals. By eating dinner, 37% saturated fat is consumed. Lunch contributes to a consumption of 26% saturated fat, followed by snacks with 21% and breakfast with 16%.The last chart illustrates the proportions of added sugar. Snacks contain the highest amount of added sugar (42%). Dinner includes 23% A typical dinner includes 23% added sugar, while lunch contains 19% and breakfast includes 16%.
All in all, the diagrams show that every typical meal consumed in the USA contains a percentage of at least 14% of nutrients that can be unhealthy is eaten too much.
- Now let’s have a look at what the examiner has to say about this 6.5 band-score answer:
Here is the examiner’s comment:
The candidate has accurately reported the data for each chart and has presented a summary of the information, but could achieve a higher score by making comparisons across the charts, e.g. breakfast contains the lowest amounts of sodium, saturated fats and added sugar. The information is logically organised and there is a clear progression throughout the script. The main points are clearly signaled [The first chart | The second chart | All in all] and there are examples of other cohesive devices [each of them]. The range of vocabulary is varied [data | contains | an equal proportion of | consumed | consumption | illustrates]. Minor errors do not cause misunderstanding [adding up 14% of sodium]. There is a mix of simple and complex sentence structure, using active, passive and modal verb forms and there is also subordination through the use of participles [Through eating lunch | By eating dinner | followed by]. More variety in grammatical structures would perhaps achieve a higher score.
Here’s how I’ve analysed this model answer and prepared a better answer:
Most of the experts in IELTS convey that a Task 1 report should have the introduction and the summary/overall trend/ general trend in the beginning of the answer. This is because the examiner always expects to gather a great impression about the candidate to score him/her better than others and the best way to get that impression is by producing a striking INTRODUCTION.
A striking introduction to a Task 1 report is produced in the following way using 2 sentences:
Sentence no. 1: Paraphrase the question title using some uncommon vocabulary but do not write too extravagant words. Keep it simple but decorate the sentence with some eye-catching and relevant words.
Sentence no. 2: Present an overview/summary/overall trend/general trend right after the introductory sentence. Remember, you are giving a summarized picture of all the information combined in the TASK 1 illustrations/diagrams/charts/tables/graphs. So, never put down any personal comments such as reasons or effects or any personal opinion.
The provided sample answer has two problems here:
First, the introduction is in three sentences which could have been written in only one sentence. Take a look:
The diagrams illustrate the average proportions of three types of nutrients in typical meals, which can be unhealthy if consumed too much. The three types include sodium, saturated fats and added sugar. The data is taken from the United States of America.
Second, the overview is given at the end, after the description or body paragraph. Additionally, the candidate has also repeated the line ‘can be unhealthy is eaten too much’ in the summary which has already been mentioned earlier in the introduction.
All in all, the diagrams show that every typical meal consumed in the USA contains a percentage of at least 14% of nutrients that can be unhealthy is eaten too much.
This could have been written right after the introduction.
The candidate could write like the following band score 8+ example introduction and summary:
The average proportions of three types of nutrients such as sodium, saturated fats and added sugar in typical American meals are compared in the depicted charts which may be detrimental to health if consumed excessively.
Overall, the charts clearly show that dinner and snacks contain more saturated fats and added sugar compared to breakfast and lunch which make the former meals unhealthier than the latter ones.
Now, let’s have a look at the body paragraph/description of the candidate’s answer and analyse it to find out the problems:
The first chart shows the average percentages of sodium. Dinner contains the most sodium (43%). Breakfast and snacks include an equal proportion of sodium consumed, with each of them adding up 14% of sodium. Through eating lunch, 29% sodium is consumed. The second chart shows the percentage of saturated fat in meals. By eating dinner, 37% saturated fat is consumed. Lunch contributes to a consumption of 26% saturated fat, followed by snacks with 21% and breakfast with 16%.The last chart illustrates the proportions of added sugar. Snacks contain the highest amount of added sugar (42%). Dinner includes 23% A typical dinner includes 23% added sugar, while lunch contains 19% and breakfast includes 16%.
- Here, in the description, the major problem is that we don’t find a good amount of comparison among the different types, and this problem contributed to the lower score. The candidate should have tried comparing between two types of meals taken by US people and show the difference of same nutrients.
- The candidate’s description doesn’t contain much sentence errors (except for with each of them adding up 14% of sodium). He could have written “Breakfast and snacks include an equal proportion of sodium which is 14%.”
- The answer also contains good usage of cohesive devices/linkers/connectors but it could have been better and that would have made the answer stand out.
Here’s a band 8+ model description that you can use:
The first chart, that presents the average rates of sodium, depicts that dinner contains the highest proportion of sodium (43%) while lunch is in the second position with 29%. Both breakfast and snacks include an equal proportion of sodium (14%) which is the lowest amount for this type of nutrient. The chart showing the rates of saturated fats display nearly the similar account of sodium. Here, dinner contains the maximum and breakfast holds the minimum amount of saturated fats. Lunch has 26% fats but snacks have 5% saturated fats less than lunch. In the third chart, snacks offer quite a contradictory picture as they contribute to the consumption of 42% added sugar which makes this type of meal the most vulnerable. Additionally, the Americans consume 23% added sugar by taking their dinner which is 4% higher than lunch and 6% more than breakfast.
This is how you can describe the charts by showing a good number comparison using simple, complex and compound sentences. I’ve also used both active and passive sentences here. I’ve used some synonyms such as present, show, depict, display, offer, etc. I’ve also used different synonyms for eat (take, consume etc.). The use of cohesive devices is ample in the introduction, summary and description, and so the answer flows smoothly.
Here’s the complete band 8+ answer for you:
The average proportions of three types of nutrients such as sodium, saturated fats and added sugar in typical American meals are compared in the depicted charts which may be detrimental to health if consumed excessively.
Overall, the charts clearly show that dinner and snacks contain more saturated fats and added sugar compared to breakfast and lunch which make the former meals unhealthier than the latter ones.
The first chart, that presents the average rates of sodium, depicts that dinner contains the highest proportion of sodium (43%) while lunch is in the second position with 29%. Both breakfast and snacks include an equal proportion of sodium (14%) which is the lowest amount for this type of nutrient. The chart showing the rates of saturated fats display nearly the similar account of sodium. Here, dinner contains the maximum and breakfast holds the minimum amount of saturated fats. Lunch has 26% fats but snacks have 5% saturated fats less than lunch. In the third chart, snacks offer quite a contradictory picture as they contribute to the consumption of 42% added sugar which makes this type of meal the most vulnerable. Additionally, the Americans consume 23% added sugar by taking their dinner which is 4% higher than lunch and 6% more than breakfast.
Word count: 209
N.B.: You need not use three paragraphs for all Task 1 answers. I’ve used an extra paragraph to show the summary/ overview/ overall trend because it is nearly of the same size of the introduction.
Click here for learning about cohesive devices/connectors/linkers/connecting words


I’ve found this article pretty useful, because I was able to compare both Sample answers for a band 6,5 and 8+ with my own essay and understood my own mistakes.But,I would be even happier if Mr. Rasul could check my essay.
Dear Muzaffarjon,
It will be my pleasure to check your writings.
Please, send me a mail to know more about the service or follow this link:
http://ieltsdeal.com/ielts-writing-correction-service-get-your-writings-checked-and-improve-further-to-higher-scores/
The charts illustrate average percentages in food meals of three kinds of nutrients, all of them can be bad for reported Americans.
Overview, details show that the Americans consume mostly sodium (43 percentage ) and saturated fat ( 37 percentage ) for dinner. Meanwhile added sugar is also consumed for the dinner but in a smaller percentage of 23.
Looking from the charts results we can see that for lunch we have almost equal percentages in consuming sodium (29 %) and saturated fat (26%). Added sugar have again smaller percentages (19%). Americans almost use the same amount of three nutritions for the breakfast. Rapidly change happends for snacks. Here the main nutrition is added sugar (42 percentage ), following the saturated fat (21 percentage) and the last is sodium (14 percentage).
All in all, the charts details us that consuming each nutritions in bigger amounts can be very damaging for health. We may consider that healthy life- style needs to be in balance between all meals of the day.
Can You please help me with rating this ?
at present i can doo ielts exam of reading module can u plss make all others modules like acadimic 15 , 16 etc or if there pls send to mail
The pie charts compare the proportions of sodium, saturated fat and added sugar in four kinds of American meals.
Overall, dinner and snacks constituted the highest percentages of saturated fats and added sugars, whereas breakfast and lunch had the lowest proportion of these nutrients.
Looking at the first chart, dinner contains more than two-fifths of sodium (43%), while lunch is in the second position at 29%. By contrast, breakfast and snacks account for the smallest amount of sodium at 14% each. In terms of saturated fats, dinner and lunch hold the highest numbers of this nutrient at 37% and 26% respectively. The figures for snacks and breakfast have roughly 5% and 10% saturated fats less than lunch.
In the USA the four types of American meals also contain a higher number of added sugars. Just under half is found in snacks, followed by less than a quarter (23%) at dinner. On the other hand, added sugar proportions for breakfast and lunch are below 20% and the difference between them is around 3%.