
Introduction to IELTS writing graphs and charts: similarities and differences, with bonus tips
Graphs and charts are some of the most common items in IELTS Writing. So, here’s a post to help you fix some misunderstandings about IELTS writing task 1 which will, for sure, simplify your thoughts and change the way you look at Writing Task 1, particularly, graphs and charts. It will also help you to find out the similarities and differences between different graphs and charts.
First, let’s have a look at the concept of graphs and charts in IELTS Writing. We have some common questions regarding this segment such as:
- What are graphs and charts?
- How many types are there?
- What are the differences between them and diagrams?
- Why are they in IELTS Writing?
And most importantly,
- Do you need to study each of them separately?
The answers lie in the next few paragraphs.
Graphs and charts are a really great way to understand and define data. Data refer to numbered information. They can be of numerous types like:
- Prices of sold items
- Number of people working somewhere
- The population of a country or place
- Period of time you work for your company
- Values/ amounts of export and import
- Literacy or illiteracy rate in a targeted region
- Scores/ Grades you make in SAT, GRE, GMAT, IELTS
- Your yearly exam result in school or colleges
- The weekly salary distribution of a company or organization
- The numbered result of a survey or census etc.
The list can go on and on. However, as the graphs and charts are represented in pictures, we can divide them into five main categories.
- Line graph
- Column graph
- Bar chart
- Pie chart and
- Table
Let’s have a look at the pictures so that it becomes easy for you to recognize them.
-
Line graph
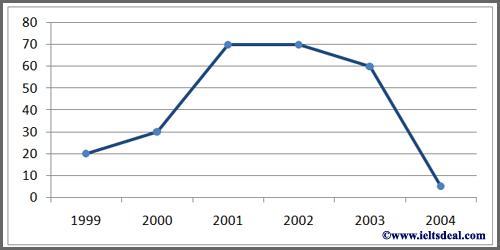
A line graph contains one or more lines representing a sequential change to some figures in a period of time.
The line graph shows the number of students who dropped out of St. Martin’s School from 1999 to 2004.
-
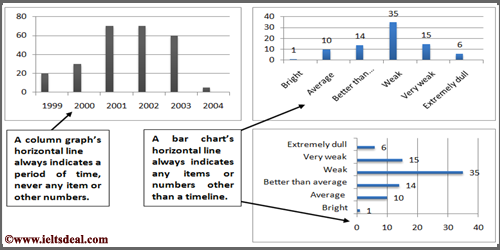
Column graph
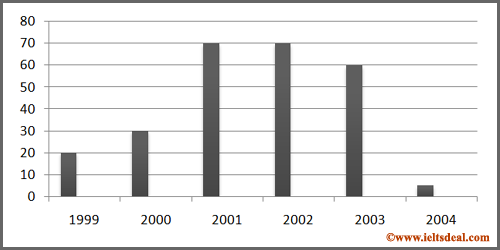
A column graph contains some columns representing a sequential change to some figures in a period of time.
The column graph shows the number of students who dropped out of St. Martin’s School from 1999 to 2004.
-
Bar Chart
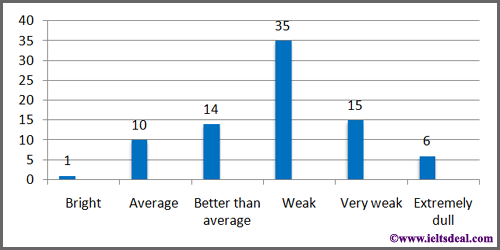
A bar chart looks like a column graph, only it represents some items or numbers in a singular time, not in a period of time.
The bar chart shows the types of students who dropped out of St. Martin’s School in 2004.
-
Pie Chart
A pie chart looks like a circular representation of some data. Generally, the percentage is given here to different items.
The pie chart shows the types of students who dropped out of St. Martin’s School in 2004.

-
Table
A table at the same time can represent a period of time, items, types, and numbers.
The table shows the types of students who dropped out of St. Martin’s School in 2004, 2005, and 2006.

Explanations of graphs and charts:
Now, as we can differentiate between graphs and charts, the broad question arises. Do we need to study all of them individually? It’s because you know that you need to study different diagrams too. So, there are many other items to cover such as several kinds of diagrams and flow charts.
The answer to this is that you need not study all the items. Some of them have so many similarities that you don’t even have to touch some of them. You just need to understand the concept of it. It might sound unbelievable. Well, let’s have a look.
Look at the example line graph and column graph pictures above. Look closely. Do they look the same to you?
There is nothing different between them except for the pictures. This is because line graphs and column graphs are actually twin brothers with differences in appearance. How?
Look at the horizontal lines (the straight line in the graphs below from left to right). In both pictures, the horizontal lines are indicating a period of time from 1999 to 2004. Remember, when a period of time or timeline (such as years, months, seasons, decades, centuries, clock times) is given in a horizontal line, a line graph and a column graph have no difference. You can study only line graphs. You just need to write the name according to the rubric or title of the graph.
The same thing goes for the bar chart and pie chart too. They are representing the same data, only in different pictures. Even the first part of the table (data for the year 2004) also shares the same data as the given bar and pie chart. So, there is a good chance for you to skip learning all the types.
Thanks for being with me so far. It means that you are slowly getting the concept.
Now, the trouble comes when you see a bar chart and column graph. It is because they look the same. Well, you need to have sharp eyes here. Remember I told you that the horizontal line of the line graph and the column graph represents a period of time? Look closely at the bar chart. Is there any timeline here? You can’t see any other time except for 2004 in the title. That’s the difference. A bar chart represents item types whereas a column graph represents a timeline. The usual columns in a bar chart can be both horizontal and vertical. If it’s vertical, it’s easy for you. If it’s horizontal, it gets difficult to differentiate between it and the column graph. That’s why; please take a look at the picture below which will surely clarify the differences.
Now, you know how to differentiate between column graphs and bar charts.
I hope this post has been helpful and you have corrected any misconceptions you might have about graphs and charts. Remember to study regularly.
Bonus tips: As you have been so patient to read this short article, here are some bonus tips for your further better preparation for writing task 1.
- Practice completing a report within 15 minutes. Task 2 is worth double the score of task 1, so you should try to use less time in task 1.
- Try to do some drawings of graphs and charts on your IELTS exercise books. You can also do the same on your Mac or MS Word. It will genuinely help you to understand the key features of graphs and charts. Try it!
In the upcoming lessons, I’ll try to discuss more some other intricate and critical issues of IELTS Writing Task 1.
Please put down your comments and ask me anything regarding this post. Your relevant queries will be answered as soon as I see them.
Click here for solutions to Cambridge Test 6; complete speaking test
IELTS Speaking Part 2: A teacher who has greatly influenced your academic life
Cambridge IELTS 12 Test 5; complete the Speaking test with model answers
IELTS Speaking Part 2: Something useful you learned from your family
6 IELTS Preparation Tips for Reading Section
IELTS Reading: 10 steps which helped me to score 8.0 in Reading
Strategy for IELTS Reading: TRUE, FALSE, NOT GIVEN or YES, NO, NOT GIVEN

Thank you so much the given information was very helpful and time saving.
it’s my pleasure. I’m developing some important items for IELTS here in this website. Do pay a visit every now and then. And if you have any query, don’t be shy to comment.
Welcome.
Welcome. Any queries?
Thank you so much. The website is awesome and helpful for me.